4 Ways to Measure the Success of AP Automation
AP & P2P Analyst

Accounts payable automation is a clear solution for any organization looking to improve key performance indicators (KPIs) for accounts payable, especially when dealing with a high volume of invoices. It’s not surprising that the global AP automation market size is likely to hit $3,079.4 million by 2028 with a compounded annual growth rate of 7.4%.
As more companies digitize accounts payable processes, how will companies measure the success of AP automation?
Tracking AP Automation ROI
Return on investment from AP automation considers the total return generated from automation technologies versus the total cost of acquiring and integrating an automation solution.
Returns generated through automation should account for:
- Quantitative benefits, such as reduced costs (from labor productivity, lower fraud, and lack of duplicate payments or late payment penalties), improved cash flow, and efficiency metrics derived from KPIs for accounts payable
- Qualitative benefits, such as higher employee satisfaction from automating repetitive and manual tasks, better vendor relationships, improved compliance, and increased visibility
Meanwhile, AP automation costs include:
- Implementation costs, including capital expenditures for procuring hardware and software, testing, and configuration, governance costs
- Maintenance costs, such as license costs, additional configurations, integration costs, and other ongoing operational expenses
- Ancillary costs, such as costs for monitoring AP solutions, training staff, and expenses related to switching to a new accounts payable system
You can assess potential benefits even before implementation by using an ROI calculator. A high-quality provider will run a workshop to help you document current AP processes, outline any gaps to fill, and show you where you need to be. The analysis will support the business case for adopting AP automation when you need clearance from your CFO or Board of Directors.
How to Measure AP Automation Success
Investing in new technology to enhance business performance requires commitment and accountability. Here are a few ways to gauge whether AP automation is generating value for your organization.
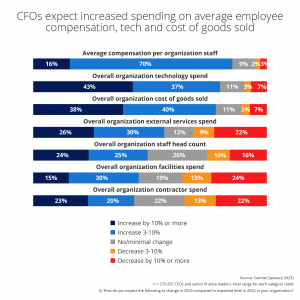
1. Establish Bold Targets for AP Transformation
Expectations from digital transformation set the tone for the entire program. Companies tend to set initial targets for transformative efforts like securing productivity improvements two to three times lower than they could be. Productivity growth can have a direct impact on the bottom line.
McKinsey reports that financial benefits from transformations deliver 2.7 times more than what senior executives expect to achieve. Reaching for the stars might actually mean landing in a better position.
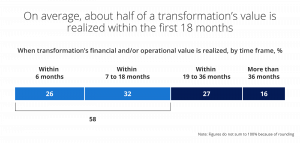
2. Use Execution Speed and Early Wins as Performance Indicators
Transformation initiatives require careful planning and execution. On average, transformation initiatives often generate about half of their value in the first 18 months. Faster execution gives organizations the opportunity to quickly generate gains from digitization.
Companies should keep a record of the following:
- Whether the AP automation rollout is on schedule
- Degree of implementation versus savings achieved
- Savings gained from automation that has been reinvested to fund additional initiatives
High-performing companies that succeed in digital transformation start strong and continue to maintain momentum. These companies also share the same strategy – creating a budget for more automation from savings gained from digital transformation.
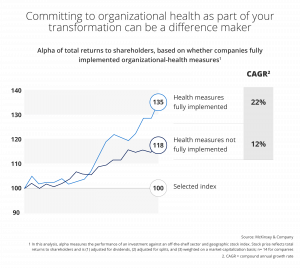
3. Measure Organizational Health
Organizations with a healthy culture attract and retain more talent and will consistently outperform peers. AP automation focuses on cutting costs and operational efficiency, but the impact of transformation on the organizational culture is another indicator of success.
AP automation brings qualitative benefits such as improved collaboration, higher employee satisfaction, and better communication. However, digital transformations often meet resistance across the organization.
Rather than focusing solely on financial performance, organizations can gauge the success of AP automation by tracking organizational health.
An indicator like the Organizational Health Index evaluates how managers and employees view management practices based on innovation, learning, accountability, and leadership. An excellent Organizational Health Index indicates a healthy company culture that often translates to higher total returns to shareholders. Using this type of metric to gauge success from AP transformation also makes it possible to rate qualitative benefits.
4. Quantify Benefits Using Accounts Payable KPIs
Knowing the efficiency of your Accounts Payable department is impossible without a measurable metric.
Determine how automation transformed efficiency using these AP metrics. Compare how KPIs changed before and after automation and evaluate how your performance stacks up against industry leaders and key competitors by using benchmarks like the APQC Open Standards.
1. Cost Per Invoice
Determine the total cost per invoice by dividing total invoice processing costs by the number of invoices processed for the period. Total cost includes expenses like labor, office supplies, and postage fees.
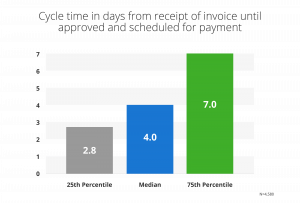
2. Average Time Per Invoice
Processing time per invoice indicates how fast or slow a company deals with an invoice. Divide the total hours spent on invoices by invoices processed for the period to get the average time per invoice.
3. Invoices Processed Per Full-Time Equivalents
Companies have to track how many invoices each full-time employee handles per month. Compute this metric by dividing the total invoices processed per month by the number of FTEs.
4. Percent of Invoice Exceptions
Invoice exceptions refer to errors such as discrepancies in the purchase order, duplicate invoices, and wrong codes.
Calculate the exception rate by dividing the total exceptions by the invoices processed during the period. This metric helps a company determine how effective automation is in reducing exceptions.
5. Early Payment Discount Capture Rate
Calculate the discount capture rate by dividing the number of discounts captured by the discounts offered by vendors. This indicator helps companies track additional savings they could have generated by making an early payment.
6. Erroneous Invoices Paid
Determine the total number of invoices with incorrect payments versus the total invoices paid for the period to get the error rate. With this metric, organizations can evaluate the effect of automation on payment accuracy.
7. Days Payable Outstanding
DPO is an indicator that shows how many days it takes the company to settle its payables. Compute for DPO using this formula: (Accounts Payable x Number of Days)/Cost of Goods Sold.
8. Time Spend Handling Vendor Inquiries
Keep a log of time spent entertaining vendor inquiries and the reason for contact.
9. Vendor Satisfaction Rates
Ask vendors to rate AP performance and continue monitoring satisfaction ratings.
Conclusion
Measuring the return on any investment requires a combination of qualitative and quantitative metrics. With thoughtful consideration of these factors, organizations can better understand the impact of AP automation on financial and operational performance, as well as organizational culture.